The incoming crypto run and the new hot chart everybody loves
Move along, there is a new HYPED chart everybody loves. Plus my thoughts on why the run is IMMINENT.
Well well well, that first bounce got sold off pretty hard BUT… tarriffs Fud is most likely behind us and we may be printing a higher low.
This is the perfect first step and stage of a reversal.
It may takes a few weeks to fully settle, but I’m still 100% long and 100% in memes.
And that’s because I trust my overall cycle forecast that much.
I did call for a “:flush” something to really exhaust longs and reset the market before we get that flow of liquidity back into crypto and equities in general.
It’s not just crypto that is about to run, it’s everything. The cause is liquidity inflows.
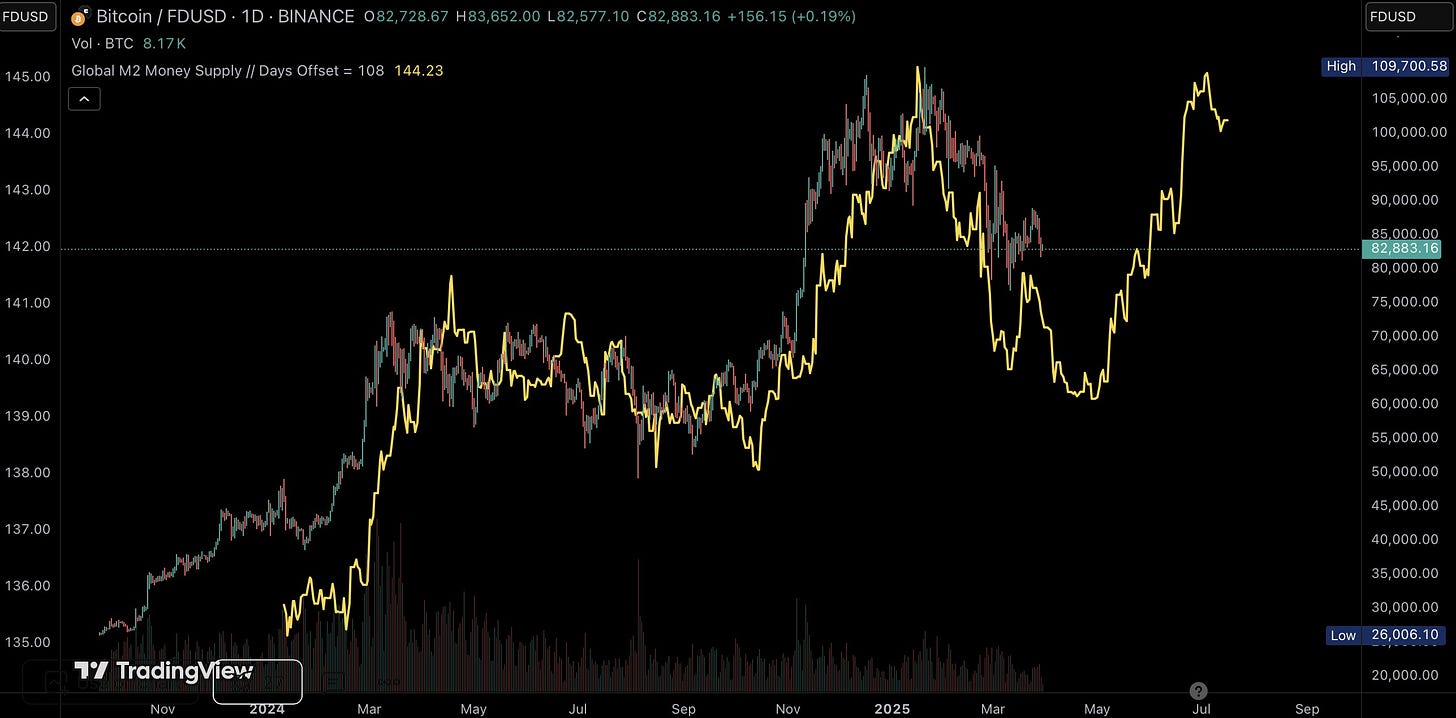
Naturally, people have found an indicator based off a m2 global liquidity supply and an offset of 107 days.
This means whatever is printed by central banks globally, takes exactly 107 days to start pumping the markets.
Some people did the work and correlation is very high.
I’ve given my opinion that I don’t think it’s sensible from a market theory standpoint. An indicator predicting the market 107 days in advance doesnt make sense.
The same way planB stock2flow doesn’t make sense. Which you can see this cycle and barely anybody talks about stock2flow.
So here is the new PlanB hype type chart of this next cycle run…
This was before we got our crash today and effectively are close to the lows, which fit the indicator’s prediction of a double bottom before “up only” mode.
This fits what I told you too.


